Tunneling
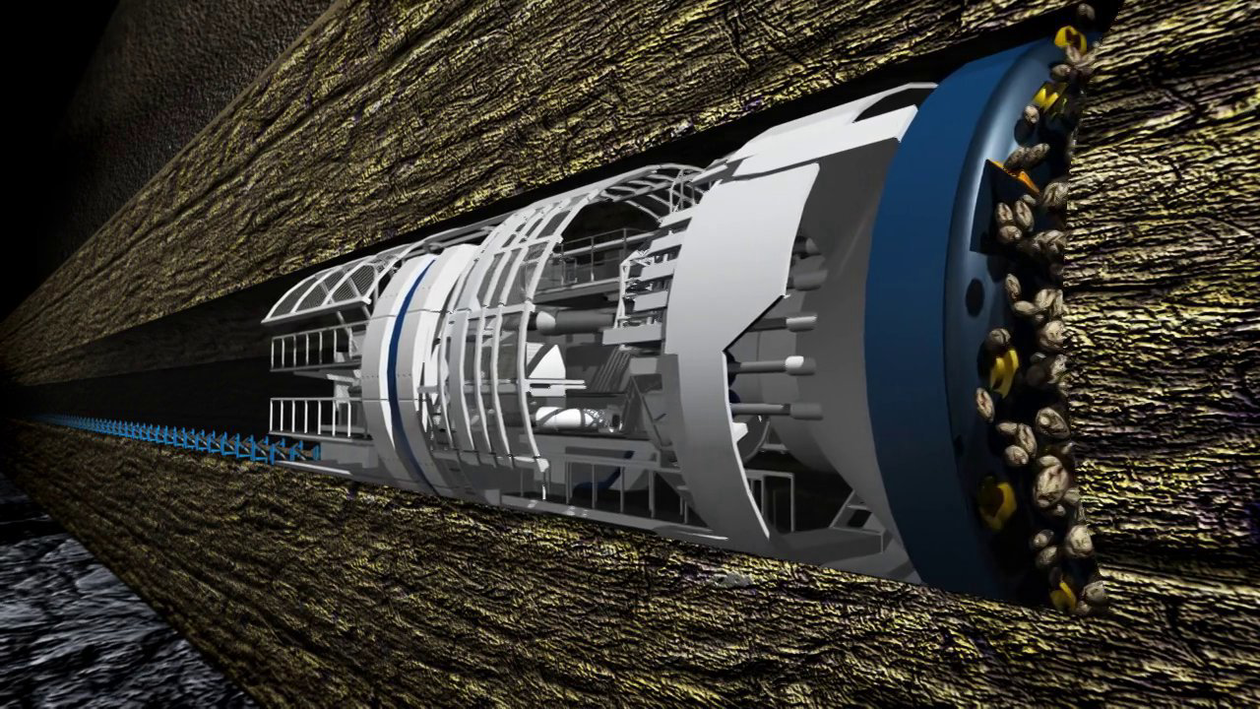
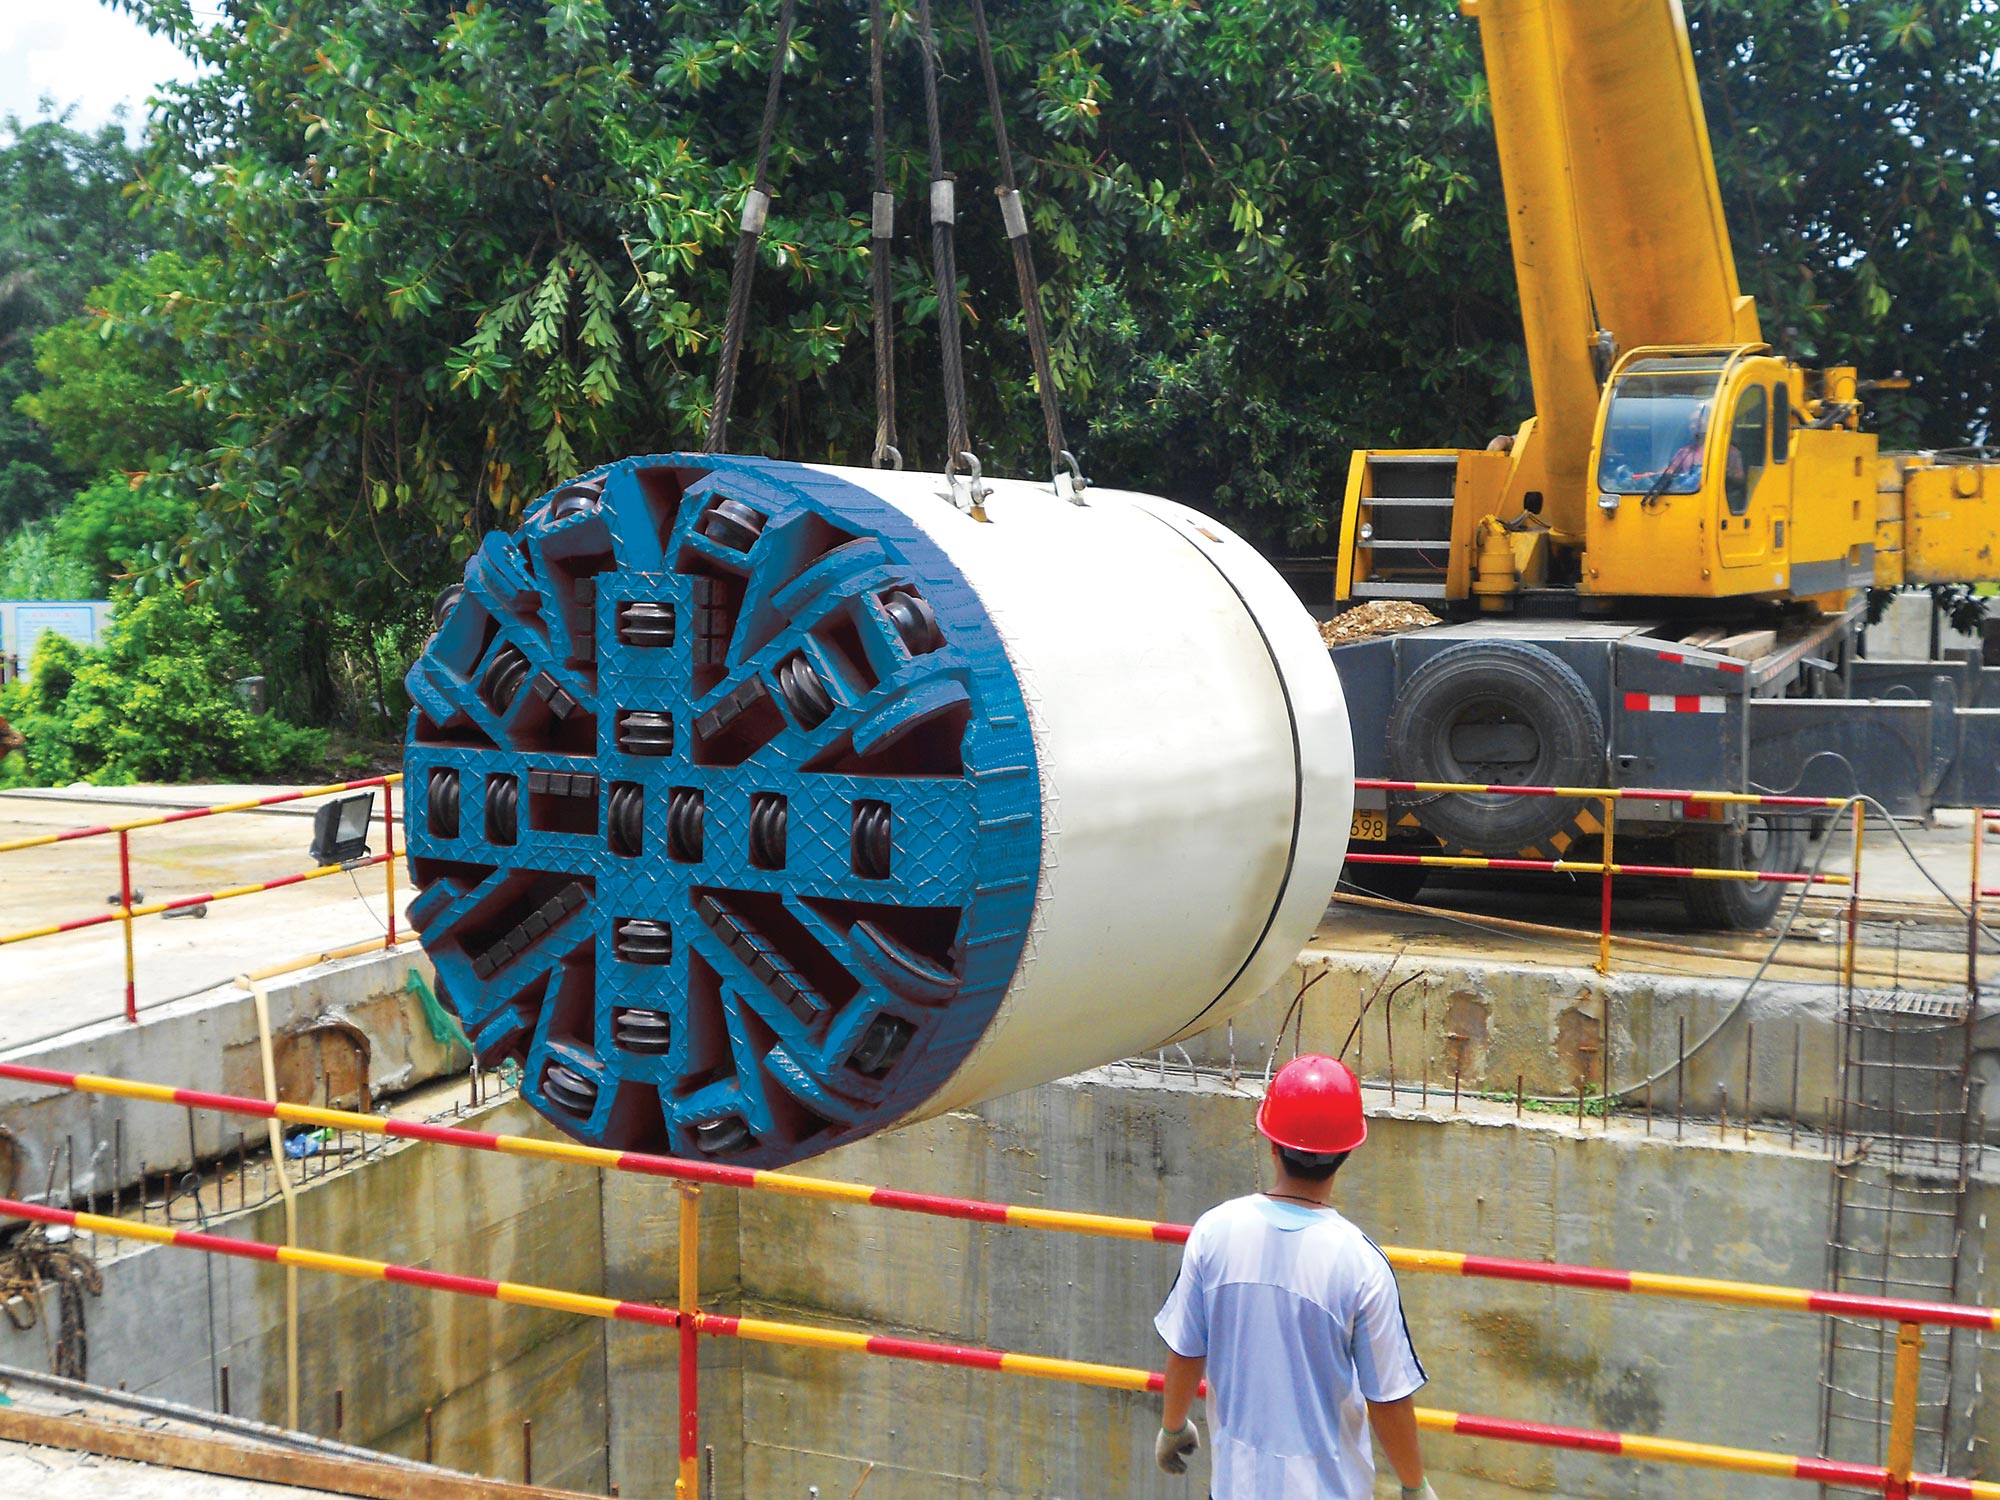
The Earth Mechanics Institute (EMI) at the Colorado School of Mines (CSM) has been performing basic and applied research and engineering for all types of excavation systems for more than 40 years. The body of knowledge acquired over this time period has allowed EMI to develop methods, which have been verified by field data, to analyze the performance of tunnel boring machines (TBMs) for hard and soft rock tunneling.
CURRENT TESTING, DESIGN, AND ENGINEERING PROGRAMS FOR HARD ROCK TUNNELING:
- Physical Property Testing
- Borehole Evaluation/Analysis
- Rock Mass Classifications
- Full Scale Cutter and Cutterhead Laboratory Testing for preferred cutter selection, optimum cutting geometry and machine specifications (thrust and power)
- Selection of Machine Type
- Cutterhead Layout and Balancing for Production Optimization evaluated by proven computer models
- Performance Predictions for penetration rates, system utilization, advance rates
- Cutter Cost Estimates
- Overall Project Costs and Completion Schedules

Projects:
- Queens Water Tunnel #3, Stage #2 (Queens, New York City, USA)
- Manapouri Second Tailrace Tunnel (Manapouri, New Zealand)
- Chattahoochee Tunnel (Atlanta, Georgia, USA)
- Lotschberg Tunnel (Switzerland)
- Gotthard Base Tunnel
CURRENT TESTING, DESIGN, AND ENGINEERING PROGRAMS FOR SOFT GROUND TUNNELING:
- Machine selection: EPB vs. Slurry machine
- Mixed face excavation assessment
- Assessment of potential problems with boulders and cobbles
- Cutterhead design and tool selection in mixed ground and soil tunneling
- Development of machine specifications for anticipated ground conditions
- Machine data logger analysis for potential claims
- Machine penetration rate and cutter wear evaluation

Projects:
Coming soon….
CURRENT TESTING, DESIGN, AND ENGINEERING PROGRAMS FOR MICROTUNNELING:
- Physical Property Testing
- Borehole Evaluation/Analysis
- Rock/Soil Mass Classifications
- Full Scale Cutter and Cutterhead Laboratory Testing for preferred cutter selection, optimum cutting geometry and machine specifications (thrust and power)
- Selection of Machine Type (slurry versus auger system)
- Cutterhead Design and Optimization
- Performance Predictions for penetration rates, system utilization, and advance rates
- Cutter Cost Evaluations
- Machine and Ancillary Equipment Availability

FIELD DATA COLLECTION AND MACHINE DATA LOGGER ANALYSIS FOR TUNNELING:
Most of the today’s modern TBM have a PLC system, which is an on-board data acquisition system in order to record all the machine parameters. The type and amount of data needs to be recorded depends on machine type and ground conditions. This type of information is very vital how to define the behavior and performance of the machine in varying rock conditions. EMI analyzes machine data logger from various TBM project by using customized Excel macro programs developed at the Institute.
TUNNELING DATA LOGGER ANALYSIS
INTRODUCTION
Most TBMs are fitted with an automatic state-of-the art machine monitoring and recording system, which is called Programmable Logical Computer (PLC). All pertinent machine parameters, including propel thrust, motor amps and voltage, number of motors running, penetration rate, etc. are monitored and recorded by this on-board data acquisition system. The data is recorded in a digital form which are downloaded directly into a spreadsheet software package or any other database programs to manipulate the data. This made the data analysis effort much more straightforward than the analog systems which have been used in the past.
DESCRIPTION OF PLC DATA LOGGER
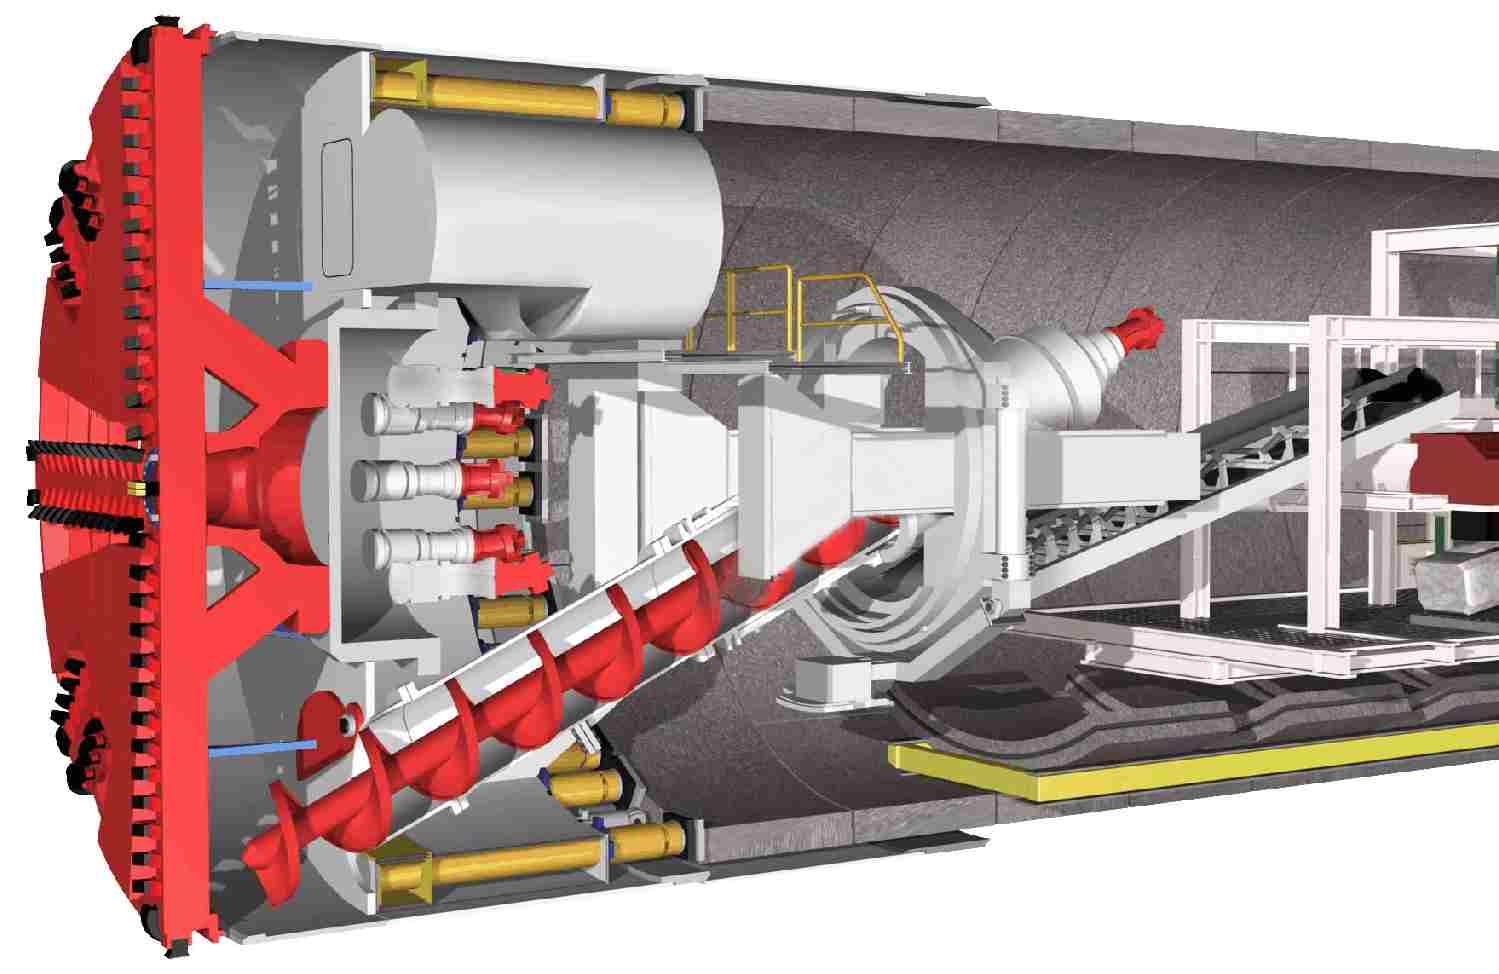
Total thrust is measured from the thrust cylinders that push the cutterhead against the cutting face (See Figure 1). The pressure transducer that measures the pressure in the thrust cylinders and this pressure value is multiplied by the area of the cylinders to calculate the load applied to the cutterhead during boring. The pressure transducer actually gives a voltage output based on the pressure in the thrust cylinders. Since, it is calibrated for voltage versus pressure, the applied force values are stored in the data file in pressure or load unit.
The measurement of the amperage output of the electrical motors (cutterhead drive units) that rotates the cutterhead in a given thrust pressure is also done through a calibrated transducer. Knowing the number of cutterhead motors (column #14) in Figure 2) that engaged at the time, one can calculate the power of the cutterhead at given thrust pressure by using the motor curve.
As seen in the following figure (Figure 2), stroke data (column #4) is the position of the thrust cylinders at that time. In other words, it tells how much the thrust cylinders were opened in length. The difference between stoke values at the start and end of a stroke is the length of the tunnel excavated during one stroke. Since data is collected digitally at certain intervals, the number of data collected per stroke (i.e. every 60 seconds) is actually time elapsed to finish one stroke. Knowing the excavated tunnel length and time elapsed; one can calculate the rate of penetration (ROP) by dividing the excavated length with time elapsed (ft/hr or m/hr). In some cases, ROP values can also be stored in the raw data file for every data point within a stroke as shown in Figure 2.
The following figure illustrates an example raw data file form a PLC data acquisition system used on TBMs. These raw data files are used to calculate the actual machine thrust and power used during excavation at a certain penetration rate, and consequently, cutter loads at a given geology and rock conditions.
MACRO PROGRAM TO REDUCE TBM DATA LOGGER
Earth Mechanics Institute (EMI) have been analyzing data from different TBM projects from all over the world. An Excel macro program is used to open the daily raw data files and retrieve the data from them according to the shift schedule and user defined reduction parameters. The following window is an example for format parameters to extract the raw data files in order to calculate the machine parameters at desired station numbers.
A graphical output of the data can also be produced from the reduced data file as shown below. This plot can be used to check the data visually to see if there is any unusual behavior in the data that the program could not detect.
After the program cleans up the data by using user defined parameters, it calculates the selected machine parameters. An example summary of this final calculation is given in the following tables.
